Revenue Leakage Audit: Finding the 7% You're Losing

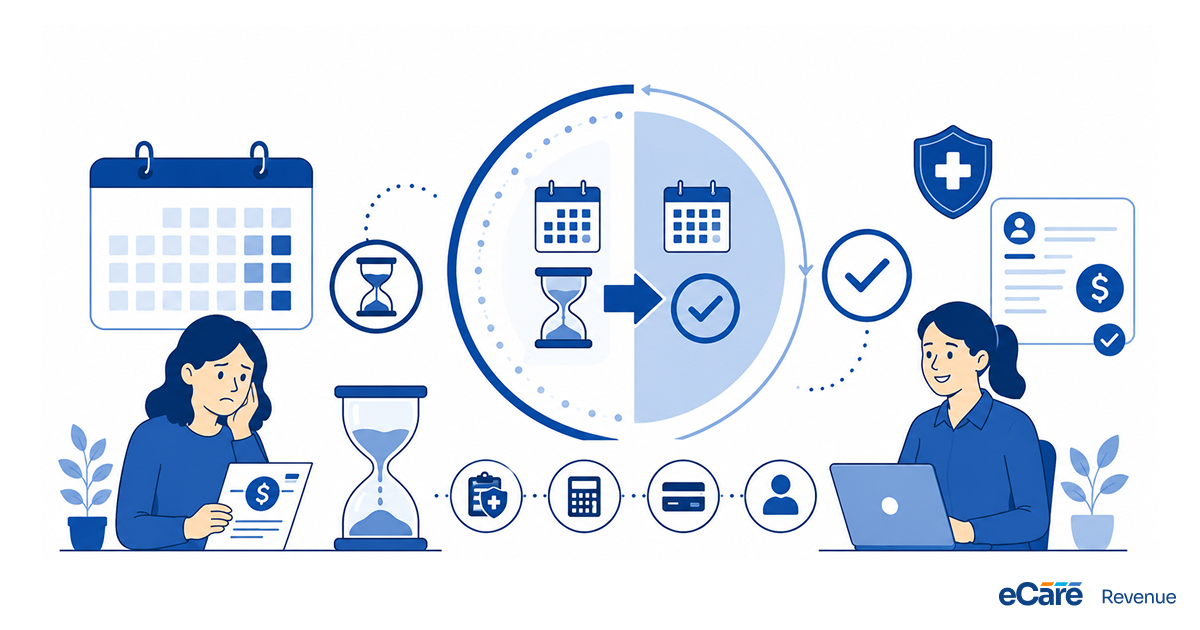
Revenue leakage in healthcare usually never comes from one big mistake. It actually builds quietly through small gaps in billing, coding, approvals, eligibility checks, and follow-ups.
In most physician practices, billing companies, and DSOs, even a one small missed revenue percentage can add up to a serious effect on overall collection without being immediately visible in day-to-day operations.
This challenge is becoming even more necessary in 2026. There are more points where claims can slow down, get denied, or lose priority in the system, as patient volumes continue to grow and payer rules become more complex.
On the other hand, teams are often already stretched thin, which makes it harder to consistently track every claim from start to finish. Over time, this creates small but consistent gaps in revenue capture.
What makes this even harder is that revenue leakage is rarely caused by one broken process. Instead, it comes from multiple small breakdowns happening across different stages of the workflow.
A missing detail during intake, a coding mismatch, a delay in submission, or a denied claim that doesn’t get followed up properly—each of these may seem minor on its own, but together they create a steady drain on revenue.
The biggest challenge is that these leaks are often hidden inside normal operations. On the surface, everything may look fine—claims are being processed, payments are coming in—but the system is not performing at its full potential. That gap between “what should have been collected” and “what actually came in” is where revenue quietly slips away.
This is why revenue leakage audits are becoming so important. Instead of focusing only on increasing patient volume or service output, organizations are now paying closer attention to how much of their existing revenue is actually being captured. The goal is no longer just growth—it is also protection of what has already been earned.
Let’s explore the major leakage categories, how to size them, and how healthcare teams can systematically identify and reduce the hidden 7% they are losing over time.
The 6 leakage categories
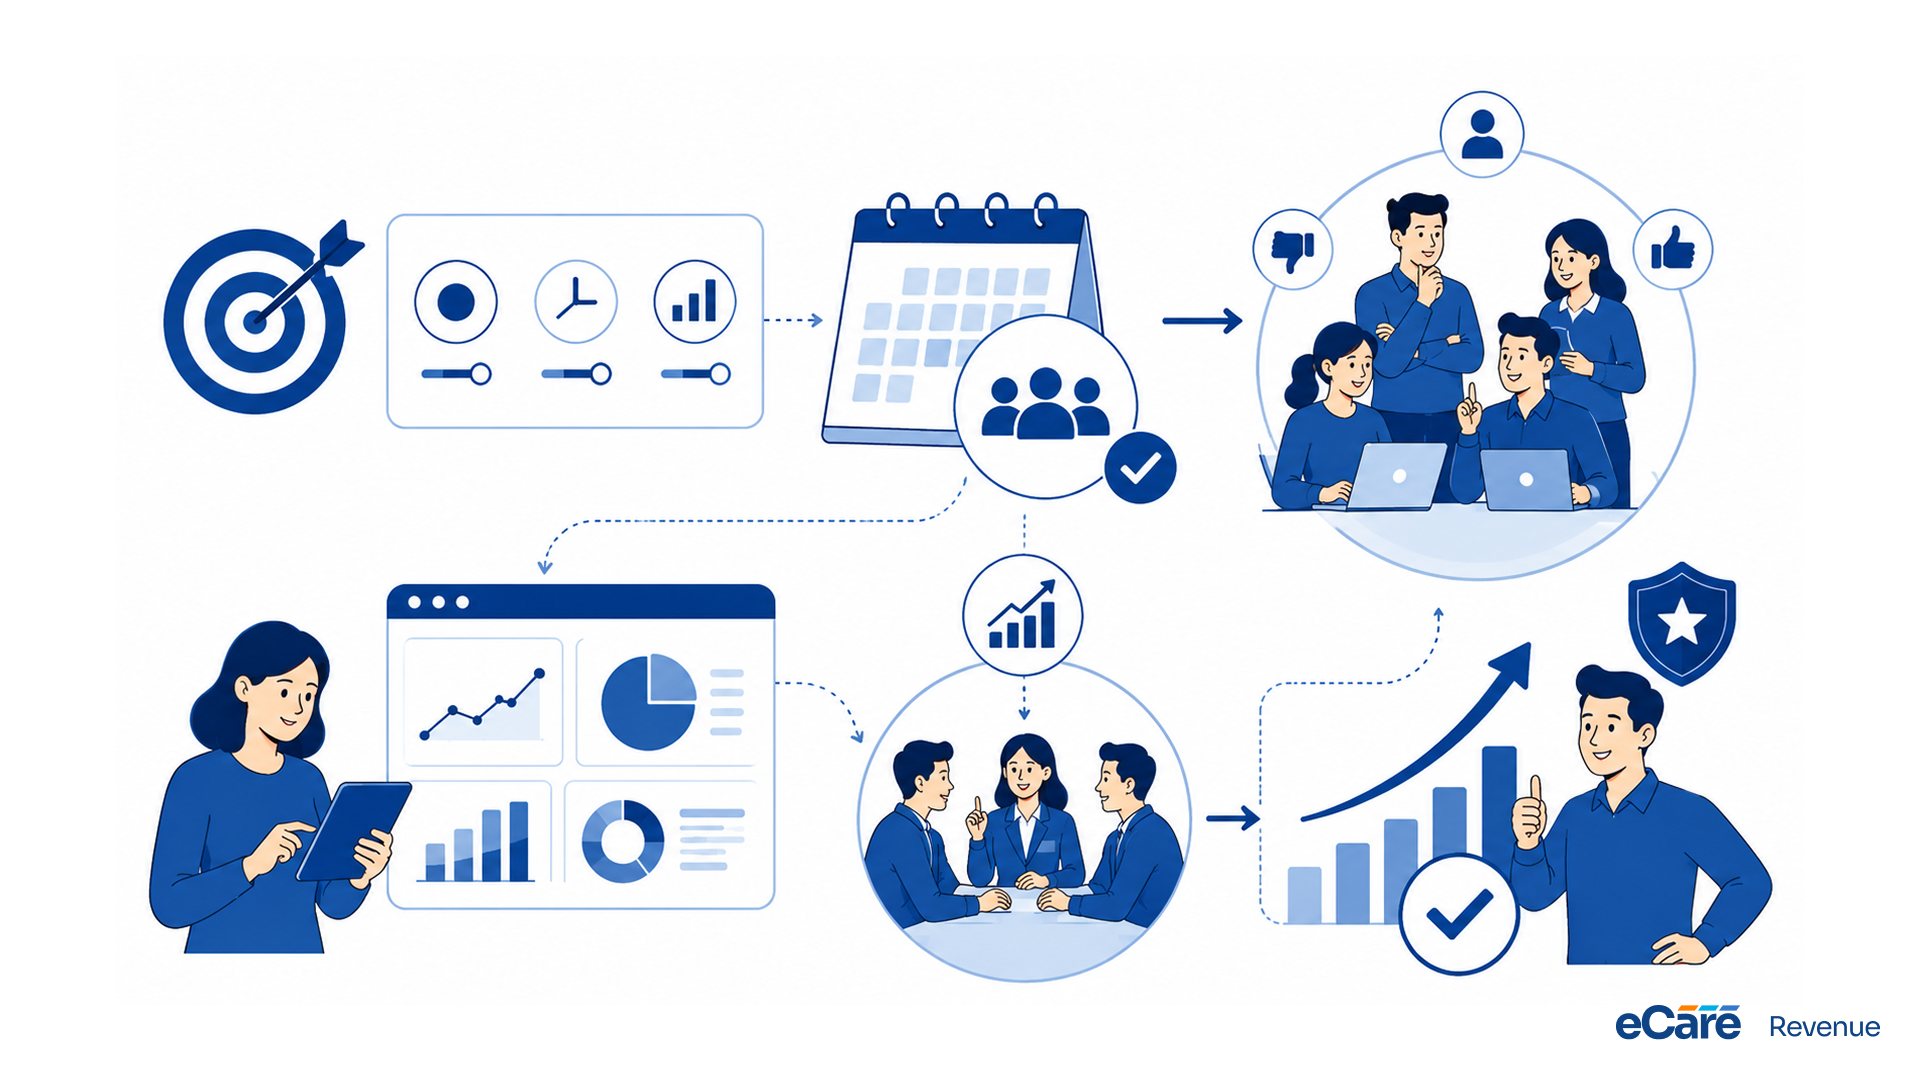
When we look at the 6 leakage categories through the lens of physician practices, billing companies, and DSOs, the picture is more nuanced than the marketplace conversation suggests. Most teams approach this as a tooling question, but the leaders we work with treat it as a workflow design question first and a tooling question second. The difference shows up in deployment velocity, in user adoption curves, and ultimately in the durability of the gains six and twelve months out from go-live.
The practical framework starts with a sharp baseline. Before any eCareRevenue capability is introduced, the team needs to agree on three numbers: where they are today, where they want to be in 90 days, and where they want to be in 12 months. Without those three numbers documented at the start, every subsequent decision becomes a debate about taste rather than a decision against a target. Teams that skip this step typically spend the first quarter relearning what they should have agreed on at the kickoff.
In practice, what this looks like is a structured pilot of 30 to 60 days with a small team that represents the diversity of the broader organization. Choose pilot participants who include at least one skeptic — the skeptic's feedback is more valuable than three enthusiasts combined, because the skeptic surfaces the friction that enthusiasts power through and that everyone else will trip over at scale. Capture quantitative metrics weekly and run a structured retrospective at week 4 to feed the configuration back into the deployment plan.
Two mistakes to avoid. First, do not confuse activity with progress: the number of users onboarded is not the same as the number of users who have changed their workflow. Second, do not optimize for the wrong number: it is easy to celebrate adoption metrics while the underlying outcome metrics (revenue, satisfaction, retention, time saved) stay flat. The teams that report the strongest results twelve months out are the ones that set their dashboards on outcomes from day one and watched those numbers weekly.
How to size each
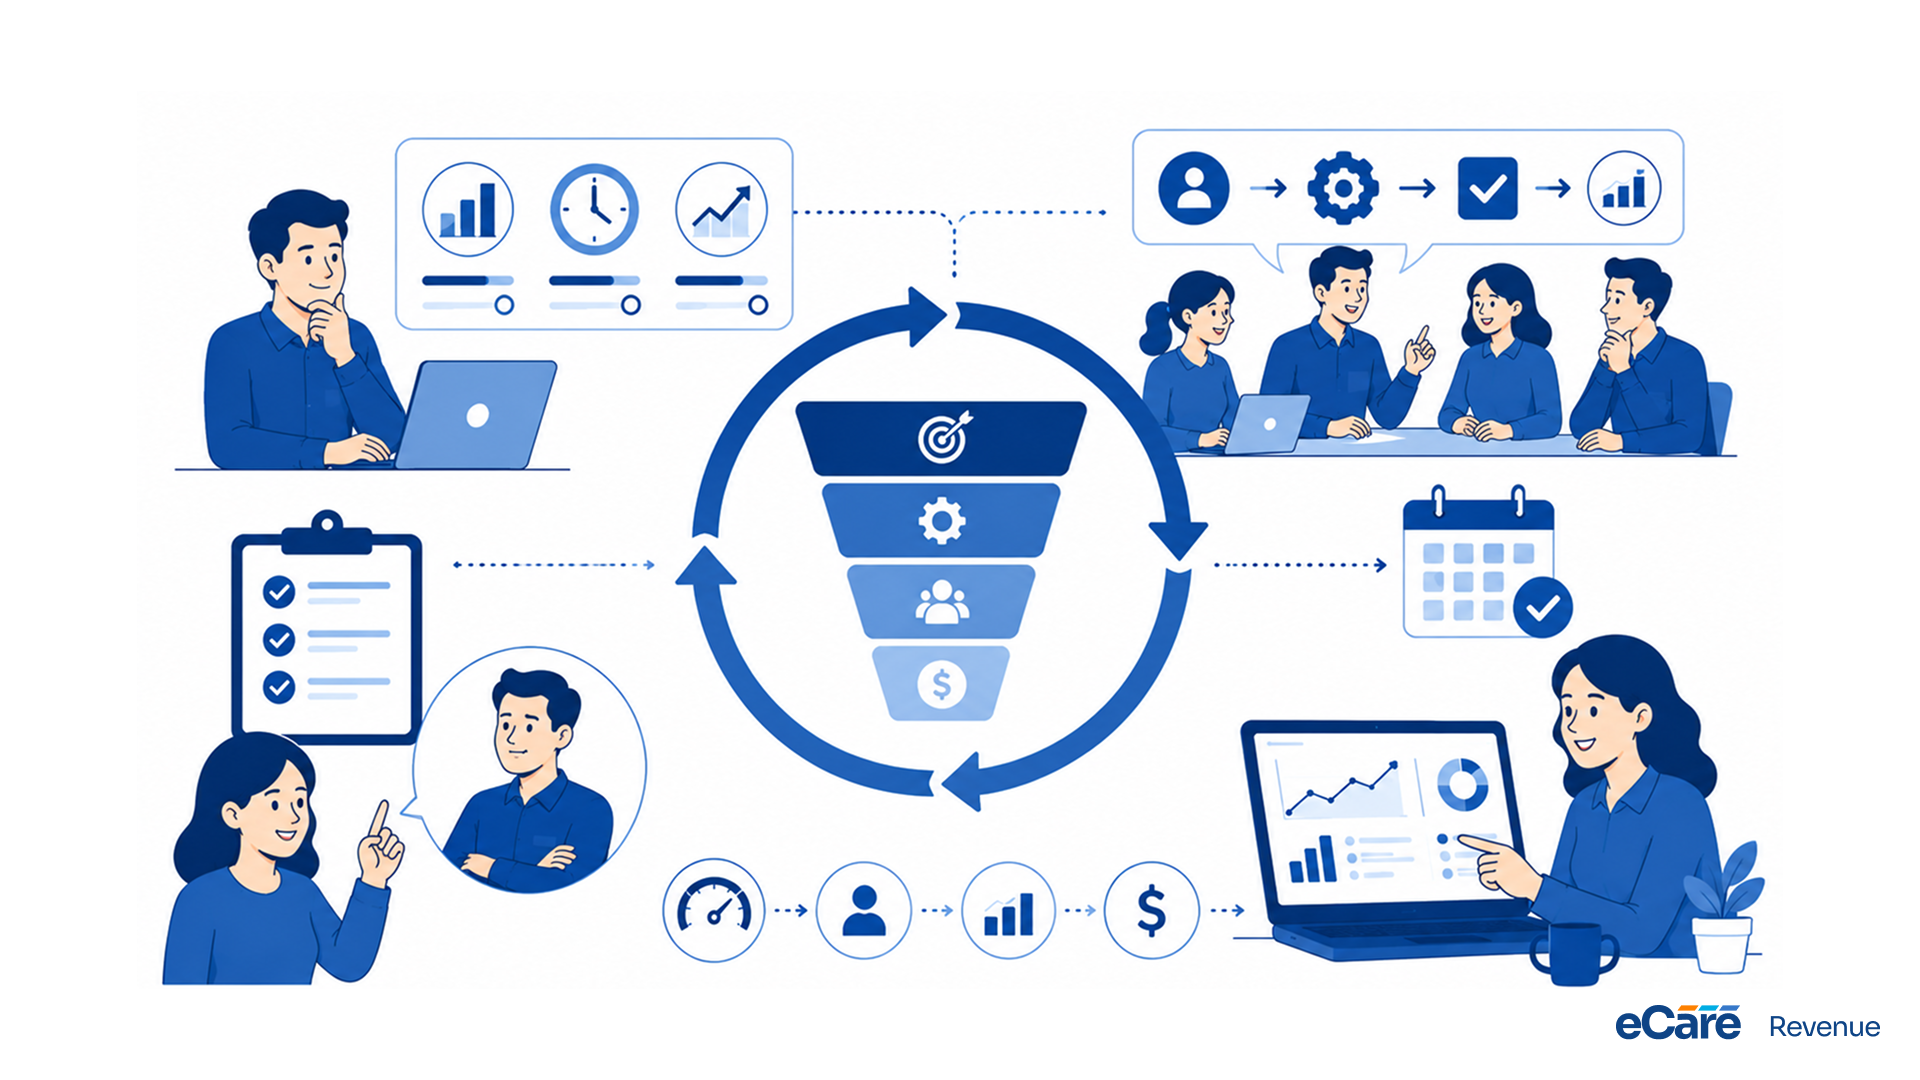
When we look at how to size each through the lens of physician practices, billing companies, and DSOs, the picture is more nuanced than the marketplace conversation suggests. Most teams approach this as a tooling question, but the leaders we work with treat it as a workflow design question first and a tooling question second. The difference shows up in deployment velocity, in user adoption curves, and ultimately in the durability of the gains six and twelve months out from go-live.
The practical framework starts with a sharp baseline. Before any eCareRevenue capability is introduced, the team needs to agree on three numbers: where they are today, where they want to be in 90 days, and where they want to be in 12 months. Without those three numbers documented at the start, every subsequent decision becomes a debate about taste rather than a decision against a target. Teams that skip this step typically spend the first quarter relearning what they should have agreed on at the kickoff.
In practice, what this looks like is a structured pilot of 30 to 60 days with a small team that represents the diversity of the broader organization. Choose pilot participants who include at least one skeptic — the skeptic's feedback is more valuable than three enthusiasts combined, because the skeptic surfaces the friction that enthusiasts power through and that everyone else will trip over at scale. Capture quantitative metrics weekly and run a structured retrospective at week 4 to feed the configuration back into the deployment plan.
Two mistakes to avoid. First, do not confuse activity with progress: the number of users onboarded is not the same as the number of users who have changed their workflow. Second, do not optimize for the wrong number: it is easy to celebrate adoption metrics while the underlying outcome metrics (revenue, satisfaction, retention, time saved) stay flat. The teams that report the strongest results twelve months out are the ones that set their dashboards on outcomes from day one and watched those numbers weekly.
Tooling that surfaces leakage
When we look at tooling that surfaces leakage through the lens of physician practices, billing companies, and DSOs, the picture is more nuanced than the marketplace conversation suggests. Most teams approach this as a tooling question, but the leaders we work with treat it as a workflow design question first and a tooling question second. The difference shows up in deployment velocity, in user adoption curves, and ultimately in the durability of the gains six and twelve months out from go-live.
The practical framework starts with a sharp baseline. Before any eCareRevenue capability is introduced, the team needs to agree on three numbers: where they are today, where they want to be in 90 days, and where they want to be in 12 months. Without those three numbers documented at the start, every subsequent decision becomes a debate about taste rather than a decision against a target. Teams that skip this step typically spend the first quarter relearning what they should have agreed on at the kickoff.
In practice, what this looks like is a structured pilot of 30 to 60 days with a small team that represents the diversity of the broader organization. Choose pilot participants who include at least one skeptic — the skeptic's feedback is more valuable than three enthusiasts combined, because the skeptic surfaces the friction that enthusiasts power through and that everyone else will trip over at scale. Capture quantitative metrics weekly and run a structured retrospective at week 4 to feed the configuration back into the deployment plan.
Two mistakes to avoid. First, do not confuse activity with progress: the number of users onboarded is not the same as the number of users who have changed their workflow. Second, do not optimize for the wrong number: it is easy to celebrate adoption metrics while the underlying outcome metrics (revenue, satisfaction, retention, time saved) stay flat. The teams that report the strongest results twelve months out are the ones that set their dashboards on outcomes from day one and watched those numbers weekly.
Prioritization framework
When we look at prioritization framework through the lens of physician practices, billing companies, and DSOs, the picture is more nuanced than the marketplace conversation suggests. Most teams approach this as a tooling question, but the leaders we work with treat it as a workflow design question first and a tooling question second. The difference shows up in deployment velocity, in user adoption curves, and ultimately in the durability of the gains six and twelve months out from go-live.
The practical framework starts with a sharp baseline. Before any eCareRevenue capability is introduced, the team needs to agree on three numbers: where they are today, where they want to be in 90 days, and where they want to be in 12 months. Without those three numbers documented at the start, every subsequent decision becomes a debate about taste rather than a decision against a target. Teams that skip this step typically spend the first quarter relearning what they should have agreed on at the kickoff.
In practice, what this looks like is a structured pilot of 30 to 60 days with a small team that represents the diversity of the broader organization. Choose pilot participants who include at least one skeptic — the skeptic's feedback is more valuable than three enthusiasts combined, because the skeptic surfaces the friction that enthusiasts power through and that everyone else will trip over at scale. Capture quantitative metrics weekly and run a structured retrospective at week 4 to feed the configuration back into the deployment plan.
Two mistakes to avoid. First, do not confuse activity with progress: the number of users onboarded is not the same as the number of users who have changed their workflow. Second, do not optimize for the wrong number: it is easy to celebrate adoption metrics while the underlying outcome metrics (revenue, satisfaction, retention, time saved) stay flat. The teams that report the strongest results twelve months out are the ones that set their dashboards on outcomes from day one and watched those numbers weekly.
Tracking recovery over 90 days
When we look at tracking recovery over 90 days through the lens of physician practices, billing companies, and DSOs, the picture is more nuanced than the marketplace conversation suggests. Most teams approach this as a tooling question, but the leaders we work with treat it as a workflow design question first and a tooling question second. The difference shows up in deployment velocity, in user adoption curves, and ultimately in the durability of the gains six and twelve months out from go-live.
The practical framework starts with a sharp baseline. Before any eCareRevenue capability is introduced, the team needs to agree on three numbers: where they are today, where they want to be in 90 days, and where they want to be in 12 months. Without those three numbers documented at the start, every subsequent decision becomes a debate about taste rather than a decision against a target. Teams that skip this step typically spend the first quarter relearning what they should have agreed on at the kickoff.
In practice, what this looks like is a structured pilot of 30 to 60 days with a small team that represents the diversity of the broader organization. Choose pilot participants who include at least one skeptic — the skeptic's feedback is more valuable than three enthusiasts combined, because the skeptic surfaces the friction that enthusiasts power through and that everyone else will trip over at scale. Capture quantitative metrics weekly and run a structured retrospective at week 4 to feed the configuration back into the deployment plan.
If your team takes one thing from this section, take this: the measurement cadence matters more than the measurement choice. Weekly cadence with a forgiving metric beats quarterly cadence with a perfect metric every time. Tighter feedback loops compound. Set the rhythm at the start of the deployment, protect it through the first 12 weeks, and the rest of the playbook does most of its own work.
Conclusion
Revenue leakage in 2026 is no longer caused by isolated billing errors—it is the result of small, repeated breakdowns across the entire revenue cycle. The organizations that consistently reduce leakage are those that identify these weak points early and address them systematically, rather than reacting after losses appear.
The biggest opportunity is not just improving collections, but building a workflow that prevents leakage in the first place through better visibility, tighter process control, and continuous monitoring.
In this model, platforms like eCareRevenue help teams shift from reactive recovery to proactive revenue protection—ensuring that what is earned is actually captured.
Frequently Asked Questions
How long does a typical eCareRevenue deployment take?
For most physician practices, billing companies, and DSOs, a sensible first deployment runs 30 to 60 days from kickoff to first measurable result. The variables that move that timeline are the depth of integration required, the breadth of pilot users in week one, and the cadence of configuration review.
What is the realistic ROI window?
The earliest meaningful ROI signal is at day 30 to 45 — typically a workflow time metric that moves first. The financial ROI signal usually appears between month 3 and month 6, depending on which baseline KPIs you set at kickoff.
How does eCareRevenue handle change management?
The change management problem is rarely about the tooling — it is about workflow design. eCareRevenue deployments succeed when the leadership team owns the workflow change story and the vendor team owns the configuration.
What integration depth does eCareRevenue require?
Most physician practices, billing companies, and DSOs run a heterogeneous stack assembled over many years. eCareRevenue integrates at the depth required by each system and exposes structured APIs for downstream tooling.
How do I evaluate eCareRevenue against alternatives?
Score each vendor on five axes: workflow fit, integration depth, configuration flexibility, support quality, and pricing transparency. Insist on a 30-day live pilot before signing a multi-year commitment.